The Brain Sterol Atlas Interface and Results
1. Overview of the Brain Sterol Atlas
We used a four-dimensional technology to comprehensively and spatially delineate the age-associated sterol lipids in the mouse brain. Ten brain regions were quantitatively analyzed from mice at the ages of 6 and 68 weeks. The Brain Sterol Atlas displays the quantitative levels (ng/mg) of 197 identified sterol lipids in the data set in a user-interactive manner.
2. Sterol lipid search across brain regions
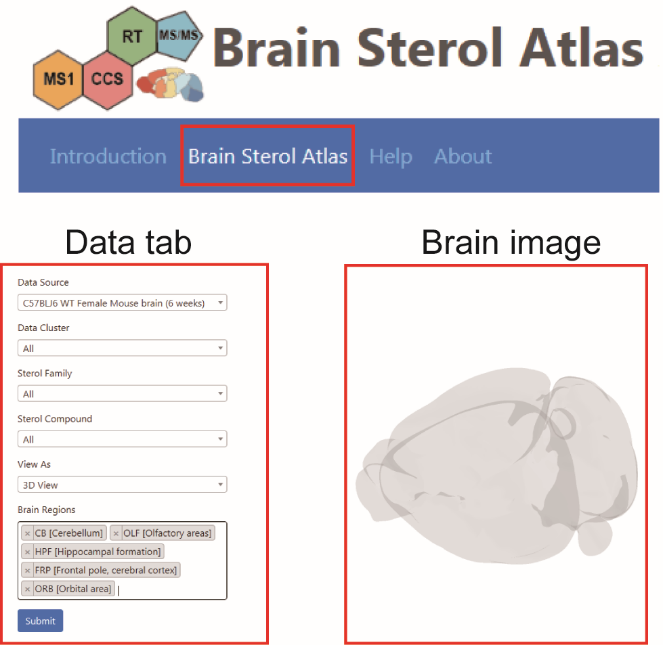
The “Brain Sterol Atlas” function directs users to the data tab to be selected (left) and a mouse brain image (right).
2.1 Selection of data set
Six parts (“Data Source”, “Data Cluster”, “Sterol Family”, “Sterol compound”, “View As”, and “brain regions”) with options are provided for users to select results of a data set of interest to be displayed.
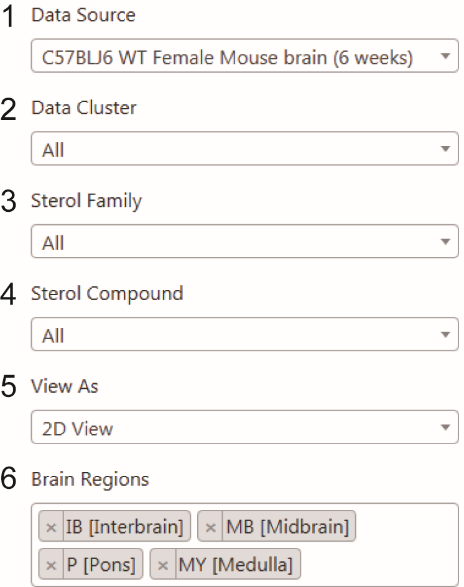
1) Data Source
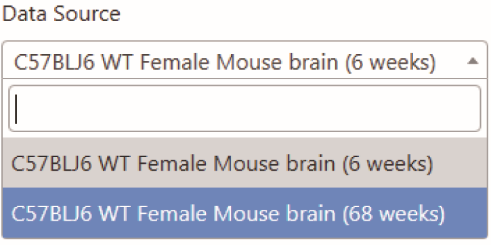
Two data sets of mouse brain tissue collected at ages of 6 weeks and 68 weeks are provided.
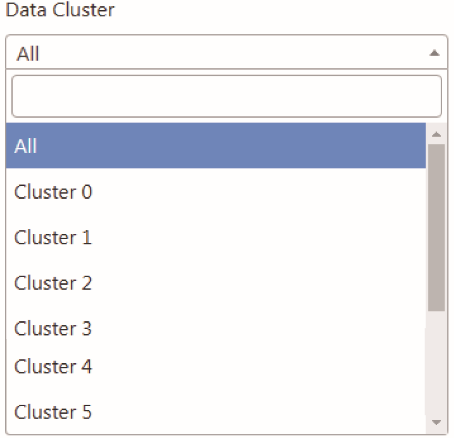
2) Data Cluster
Cluster groups were generated using hierarchical clustering analysis (HCA) of 149 differentially expressed sterol lipids across ten mouse brain regions (6- week data set).
Users can select one or multiple clusters to be displayed out.
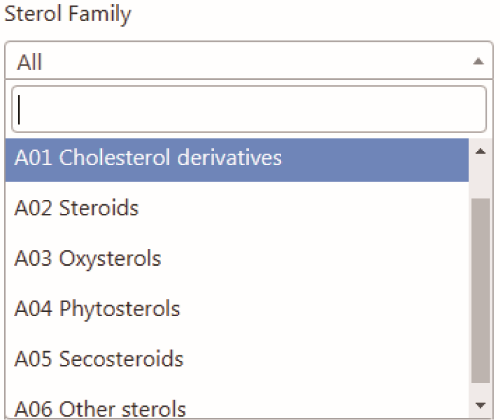
3) Sterol Family
Six sterol families are categorized, and users can select one or all sterol families to be displayed out.
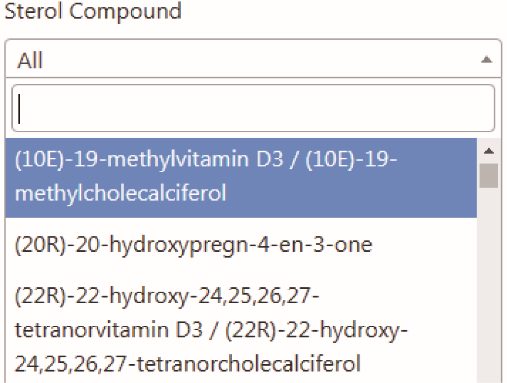
4) Sterol Compound
Users can select all sterol lipids or individual sterol lipid to be displayed out. One can also search a specific sterol lipid by name.
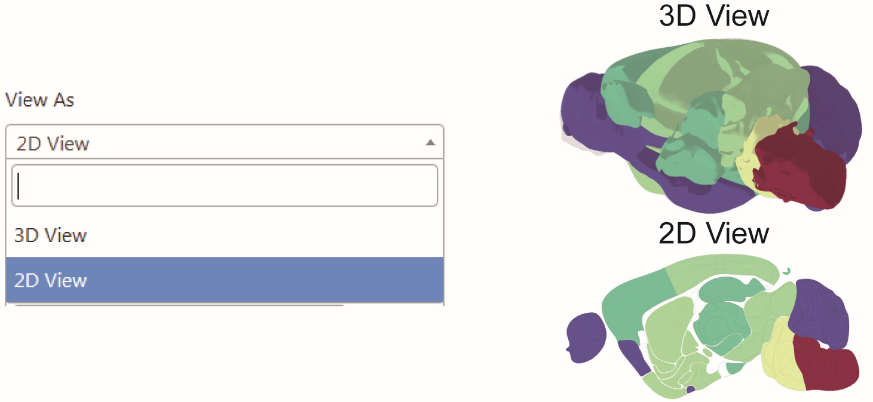
5) View As
For a specific data set defined by users, an interactive 2D or 3D map of the mouse brain could be chosen and displayed.
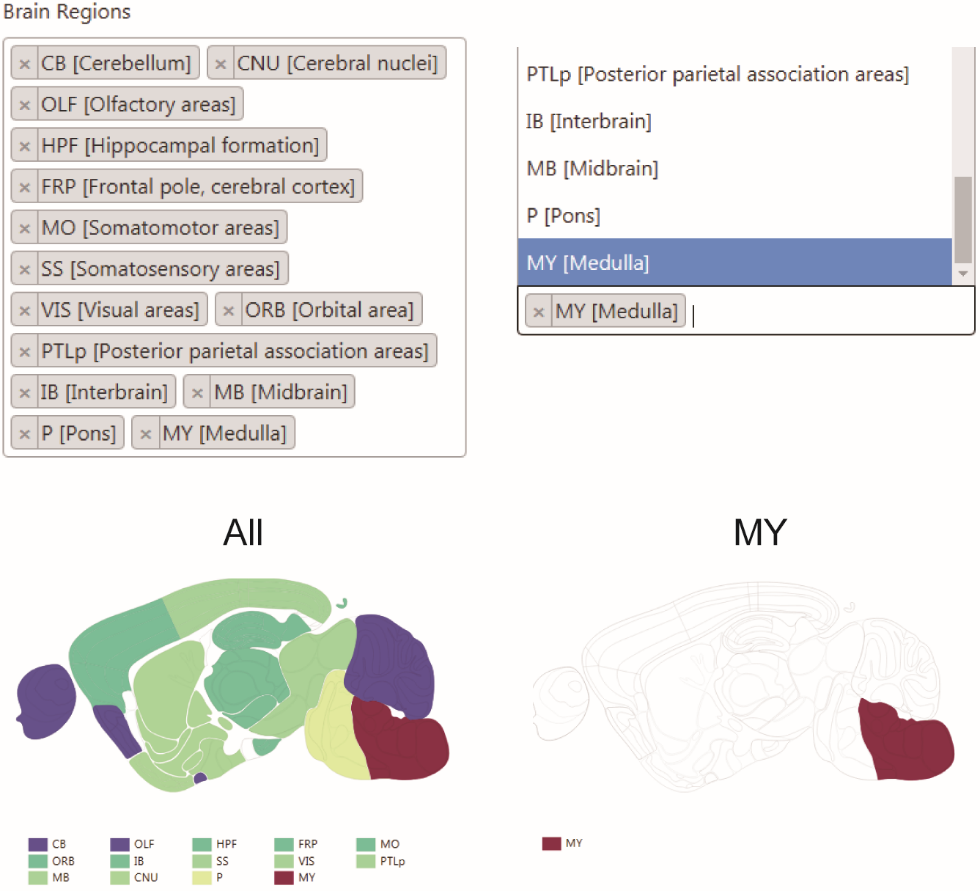
6) Brain regions
Users can select one or multiple brain regions to display the results.
Notes:
- Three brain regions in web-server including frontal pole cerebral cortex, somatomotor area, and orbital area represent anterior cortex in our publication.
- Three brain regions in web-server including somatosensory areas, posterior parietal association area, and visual area represent posterior cortex in our publication.
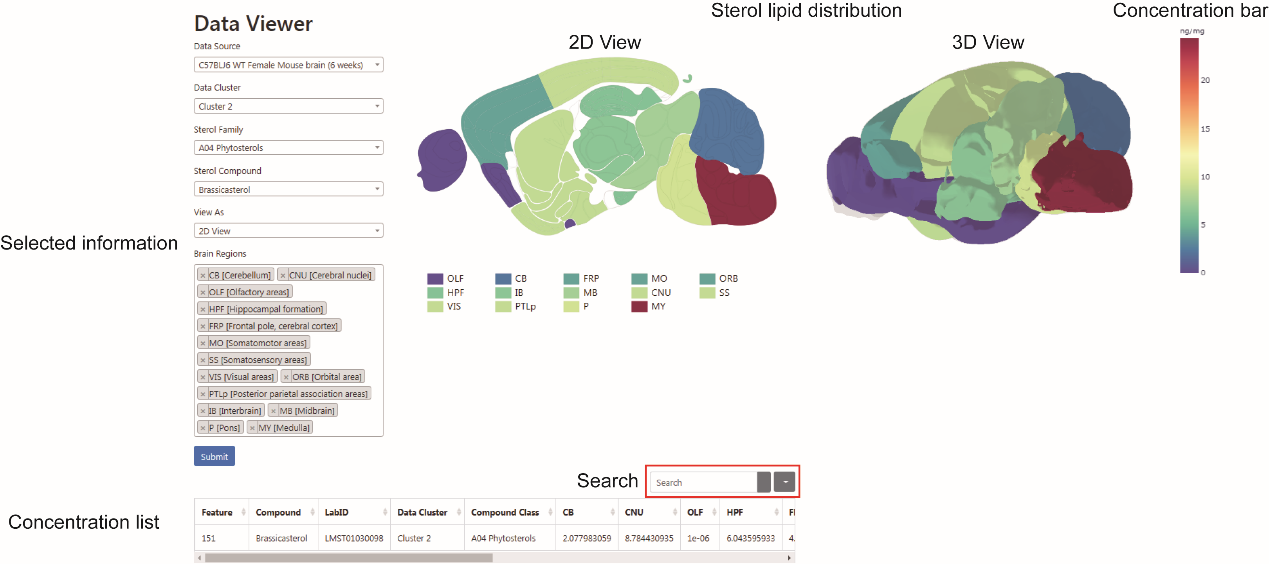
3. Output and Results
For a specific data set defined by users, both interactive 2D and 3D maps of the mouse brain colored by concentrations (ng/mg) of sterol lipids are showed. Each map is accompanied by a table detailing the information on sterol lipids and concentration values across ten different brain regions. Users are also able to search the name of a sterol lipid out of the table list.